


1/ Consider becoming a supporter, if you're not already.
2/ Know someone who might like to read this? Share it with them via the links at the bottom of the post.
3/ I also have the simplavida.com newsletter where I'm focused on simplifying health, fitness, and longevity, so consider subscribing to that too.
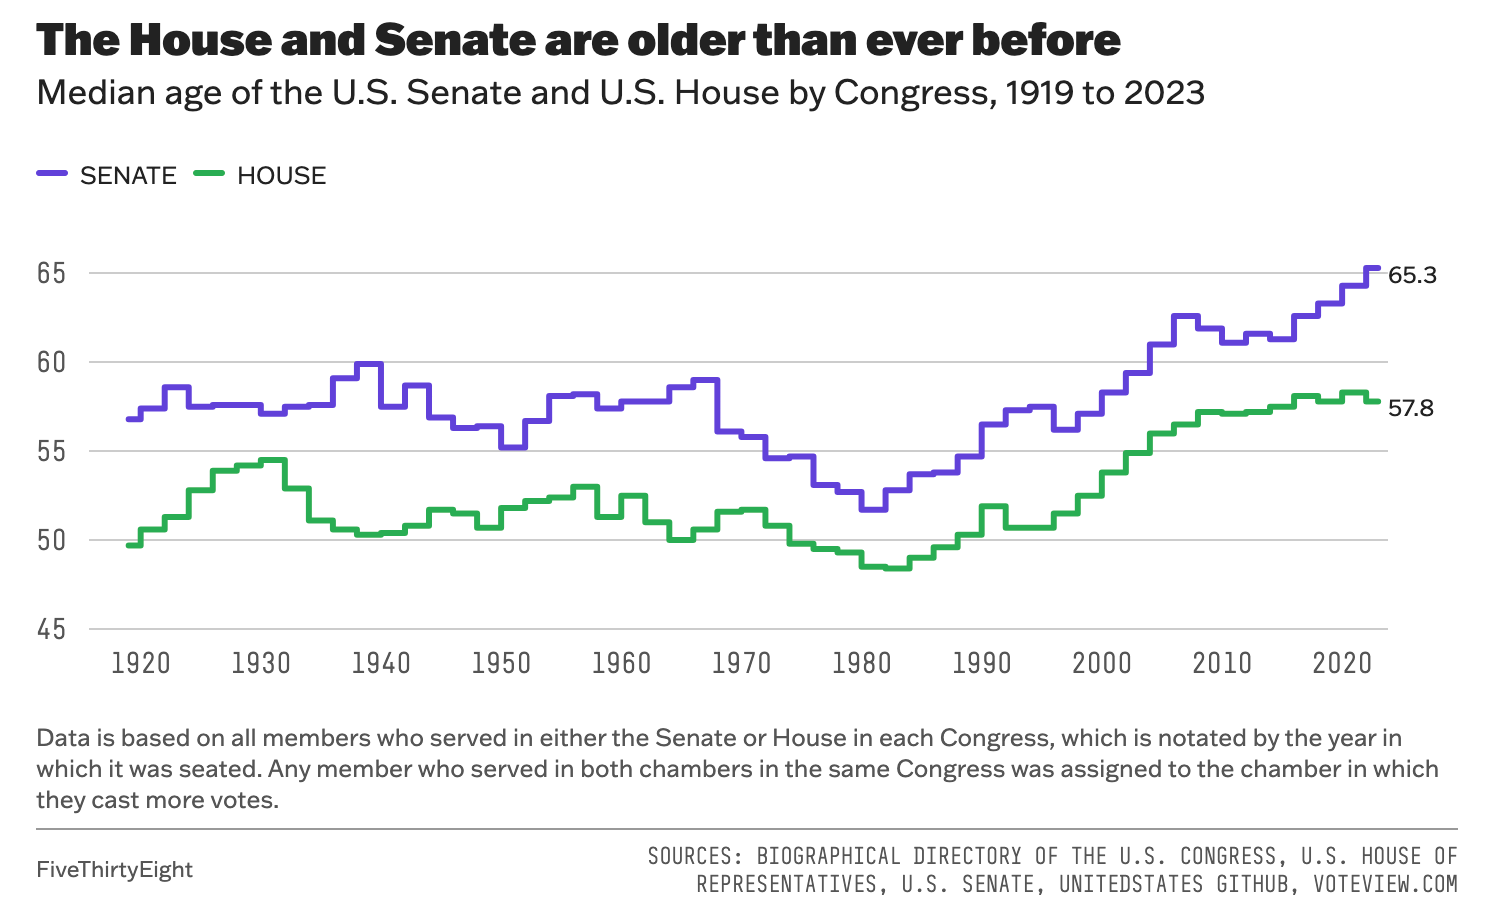
There are a lot of old people in the U.S. government. As a matter of fact, the Senate is now the oldest it has ever been, and the U.S. House of Representatives is near its record high. This has many consequences, like that Congress is less representative of the people its members represent, whose median age is 39.
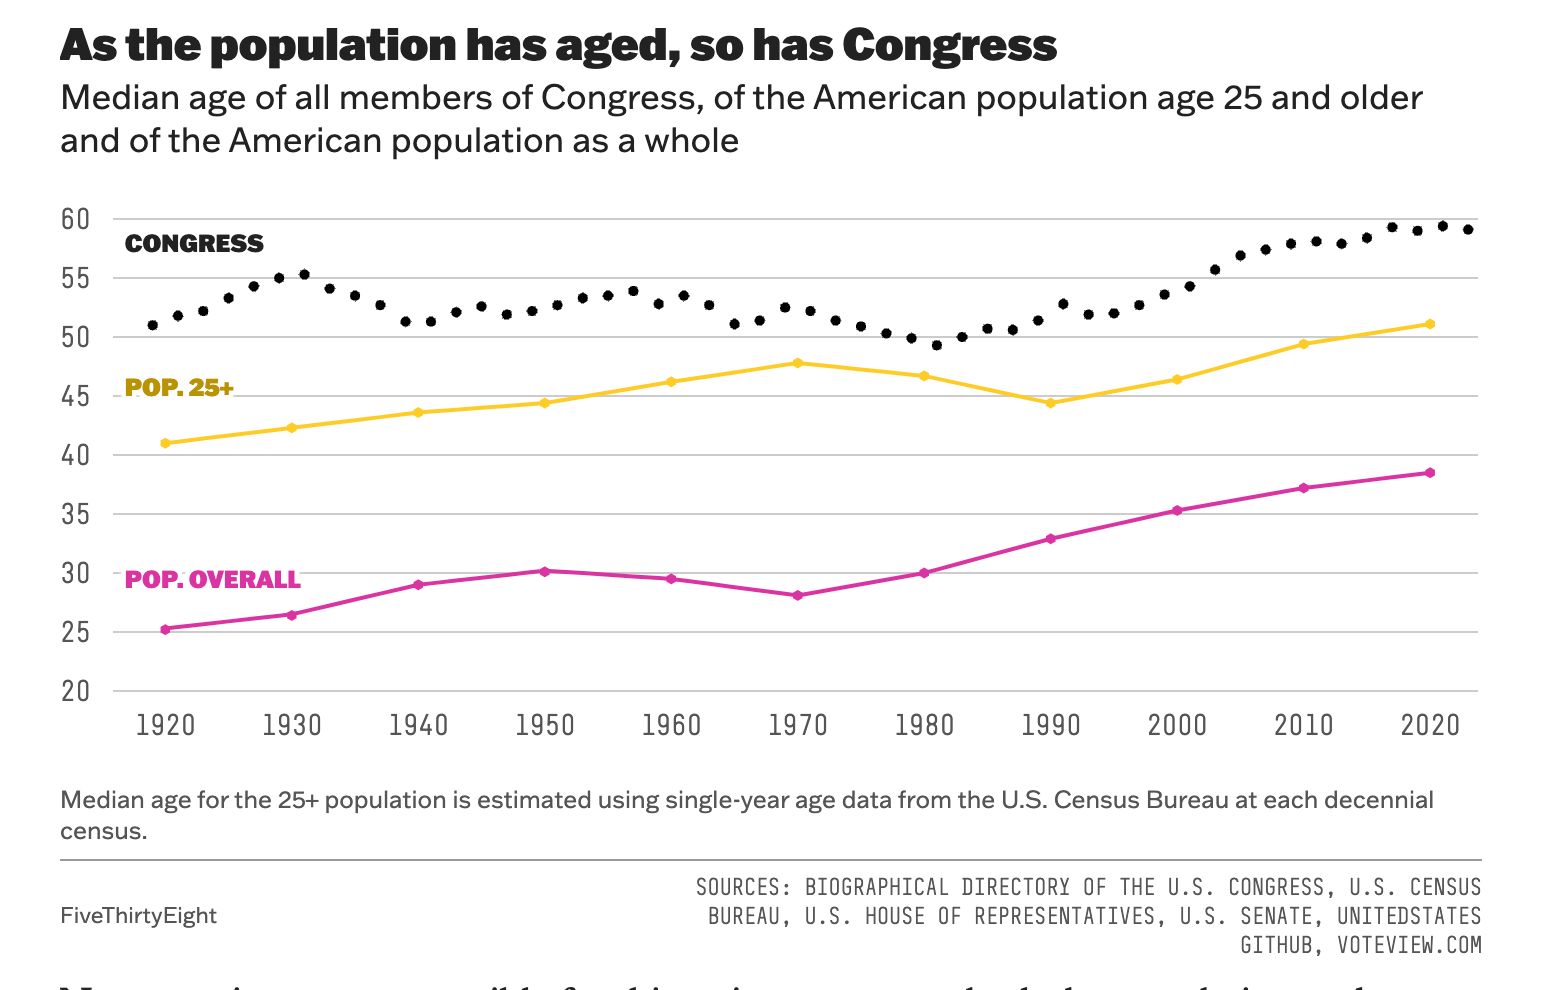
But Americans are getting much older as a group. And so Congress has, in a real sense, aged with an aging U.S. population, as the following figure shows. Congress has more or less always been 10-20 years older than the median American—it's just that the median American is older than ever.
While Congressional representative ... representativeness, or its lack thereof, is important, it's not the consequence I want to think through today. I am more interested in the dynamics of the Congressional system, given its age structure.
We know, based on standard actuarial tables, the probabilities of people dying in the next year at any given age. For example, there is a 0.01% chance of an 8-year-old dying in the next year, all else equal. That is, it turns out, as low it gets: Next-year death likelihoods are slightly higher for children younger than 8, and then they climb again for the rest of your life. At age 50 the next-year likelihood is 3%, or about half the likelihood at age 80, which is 6.5%.
Immortal Eight-Year-Olds in Finland
Given the (happily) small probability of an 8-year-old dying in any given year, it is worth considering the implications. For example, how small would a country have to be for there to be at least a 50% chance that no 8-year-olds died there that year?
We can calculate that as follows, using a binomial distribution. The probability P of exactly zero deaths among n eight-year-olds, each with a death probability p, is given by the formula for a binomial distribution where the number of successes (deaths (sorry) in this case) is zero:

We want to find n such that P≥0.5. Given that p=0.01%=0.0001, we can rearrange the formula to solve for n:

The result: In a country with 6,931 or fewer 8-year-olds, there is at least a 50% chance none of them die that year, which may be cold numbers, but is also a lovely thought. Given Western population demographics, that corresponds to a country with about a half million people, which is somewhere between the size of Iceland and Malta.
Happily, however, statistics aren't determinative. Just because it's relatively likely to happen in such a small population doesn't mean it can't happen in a much larger population. A few years ago there was a story about how no 8-year-olds died in Finland that year, which was viewed skeptically in some quarters. We can see whether such skepticism is warranted. While we know that there is a 50% chance no 8-year-olds die in any given year given a half million population, what is the likelihood of the same in a country with 5 million people, like Finland?
I won't bore you with the maths this time, but it works out to around 0.7%. So, very low, but impossible? No, not impossible. Just very, very unlikely, and unhappily so.
Congressional Mortality and Its Consequences
This trip through actuarial statistics brings us back to Congress. While there are no 8-year-olds there, there are its actuarial opposite: Many older people, as the graphs above show, given the increasing median age. There are members in their 70s, 80s, and even 90s, which is remarkable, but also has consequences.
In the same way that we did with immortal 8-year-olds, we can think through the actuarial implications for Congress, given 535 members across the House and Senate, and their ages. As we discussed above, the risk rises through life, and avoiding mortality, especially in life's later decades, gets increasingly difficult each passing year. While the likelihood isn't high in any given year, it is high enough that it adds up, probabilistically speaking.
Let's start by modeling death rates in any given year, knowing the ages of members of Congress, as we do. We can walk through the entire cohort and assign probabilities for each member, and then create an aggregate estimate of the number of deaths we are likely to see in any given year over, say, the next four.
Here are the results from my analysis:
- Year 1: ~9 deaths
- Year 2: ~10 deaths
- Year 3: ~10 deaths
- Year 4: ~11 deaths
How well does this match with historical data? Not that well, interestingly. In-office Congressional deaths per year over the last four years (via Wikipedia, so all disclaimers apply) have averaged around 3 per year, less than a third of the number of deaths per year that the actuarially-based model estimates.
So, there are a few ways to think about this:
- It's possible that it's just a fluke, that members have gotten lucky at dodging death in recent years.
- Perhaps Congressional health care is so good that they have a lower death rate than the broader population.
- Maybe my analysis is wrong.
- Maybe Congressional members are so wildly different, socioeconomically speaking, from the broader population that we can't apply standard actuarial tables.
Which one applies here? I think maybe mostly 2) and 4): they have good care, and they come from good socioeconomic stock, both of which, studies tell us, have significant effects on illness and early death. The analysis itself is fairly generic and by the book, so that doesn't seem the issue here.
While the above are point estimates, it is more useful to think of the distribution of deaths itself as a distribution. One way to estimate that is via a Monte Carlo simulation, where we run the same trial repeatedly and record the results. So, here is the distribution of deaths from 1,000 simulations:
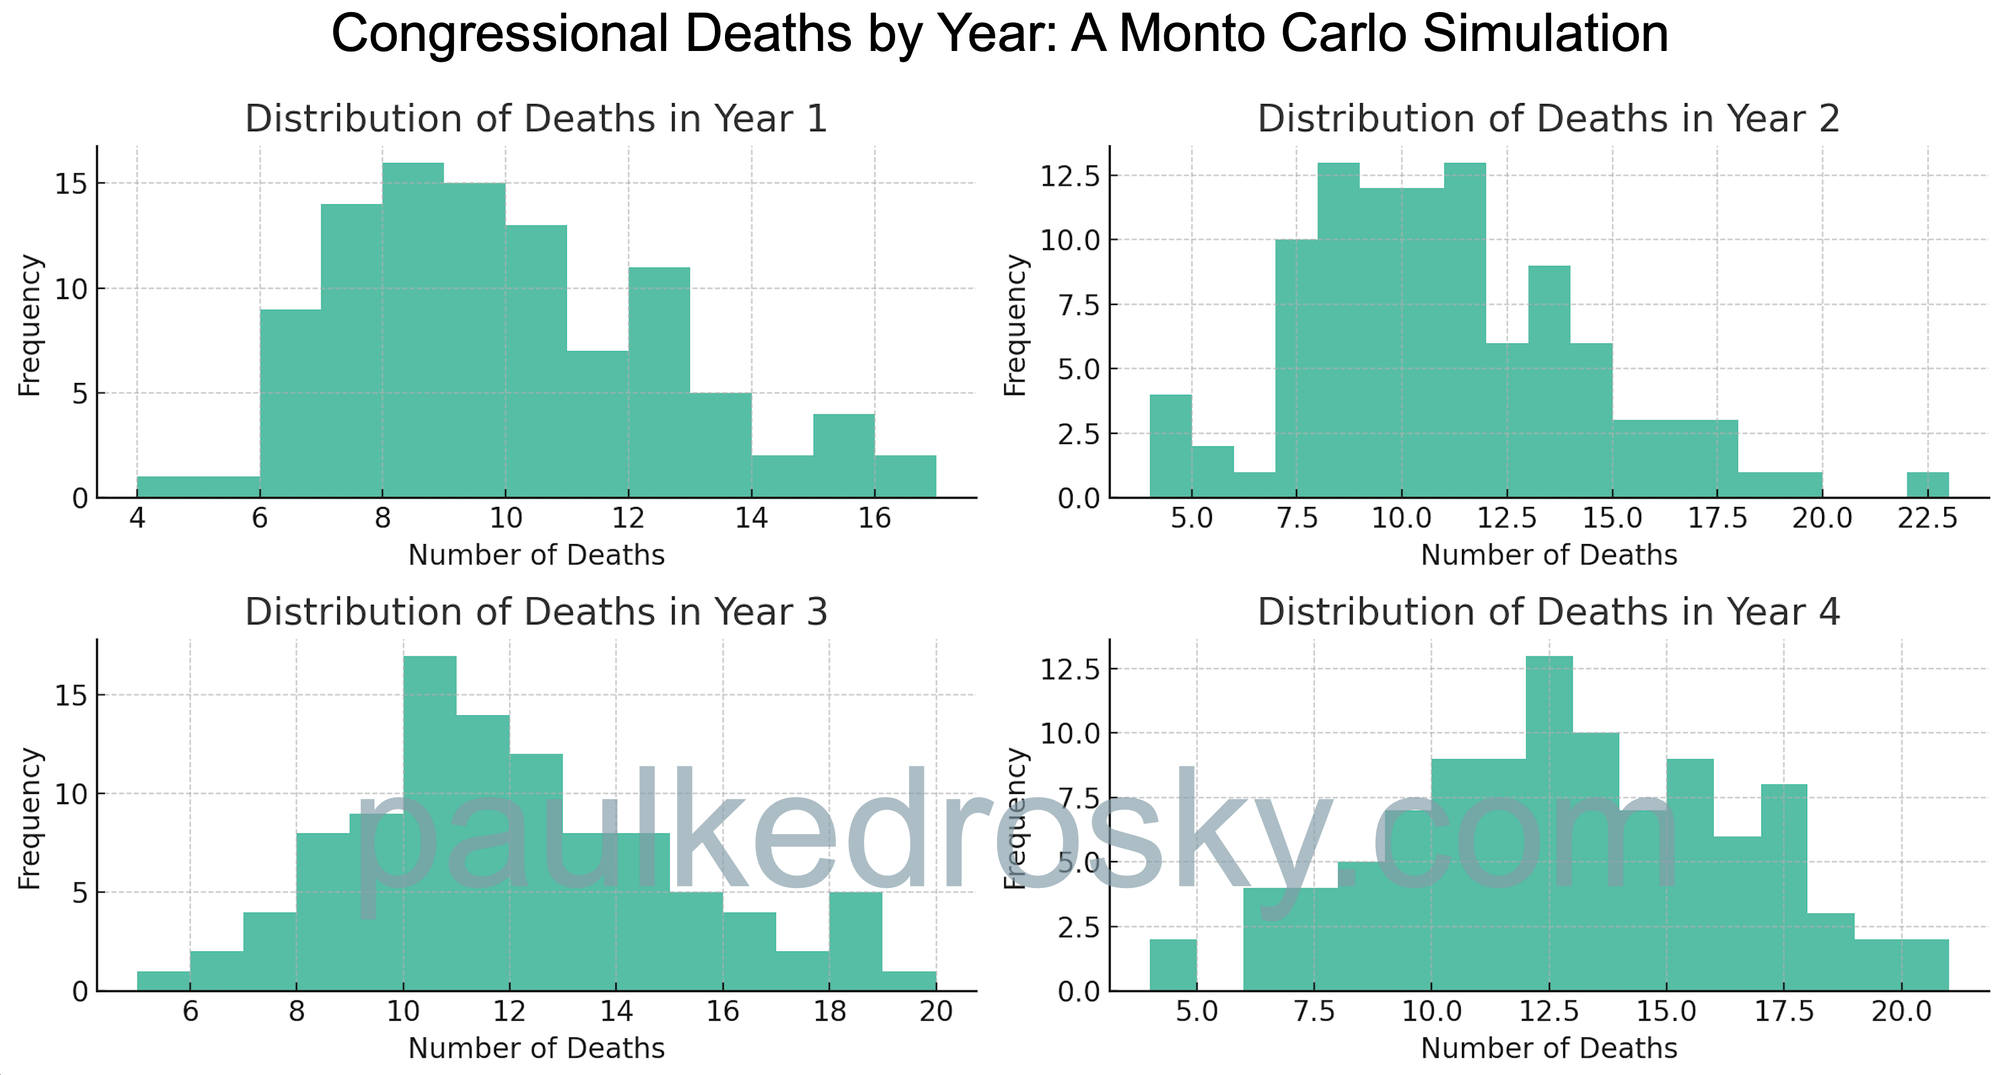
What should be striking here is the long tails that are possible. While the kind of small numbers we have seen in recent years are unusual, they are within the distribution. At the same time, and more importantly for this analysis, there are some possibilities at the other end of the tail. It wouldn't be unrealistic to have years with 10 or even more members die in office.
Why do we care? In part because it is an interesting exercise in independent probabilities in a complex system. Given all of these discrete interacting probabilities, we should expect the unexpected. So we care because while small numbers are possible, and perhaps even likely, large ones are more probable than naive intuition might suggest. In a country as politically divided as the U.S. that would be problematic and even destabilizing.

