An onoing chart war started with this widely shared graph from Apollo.
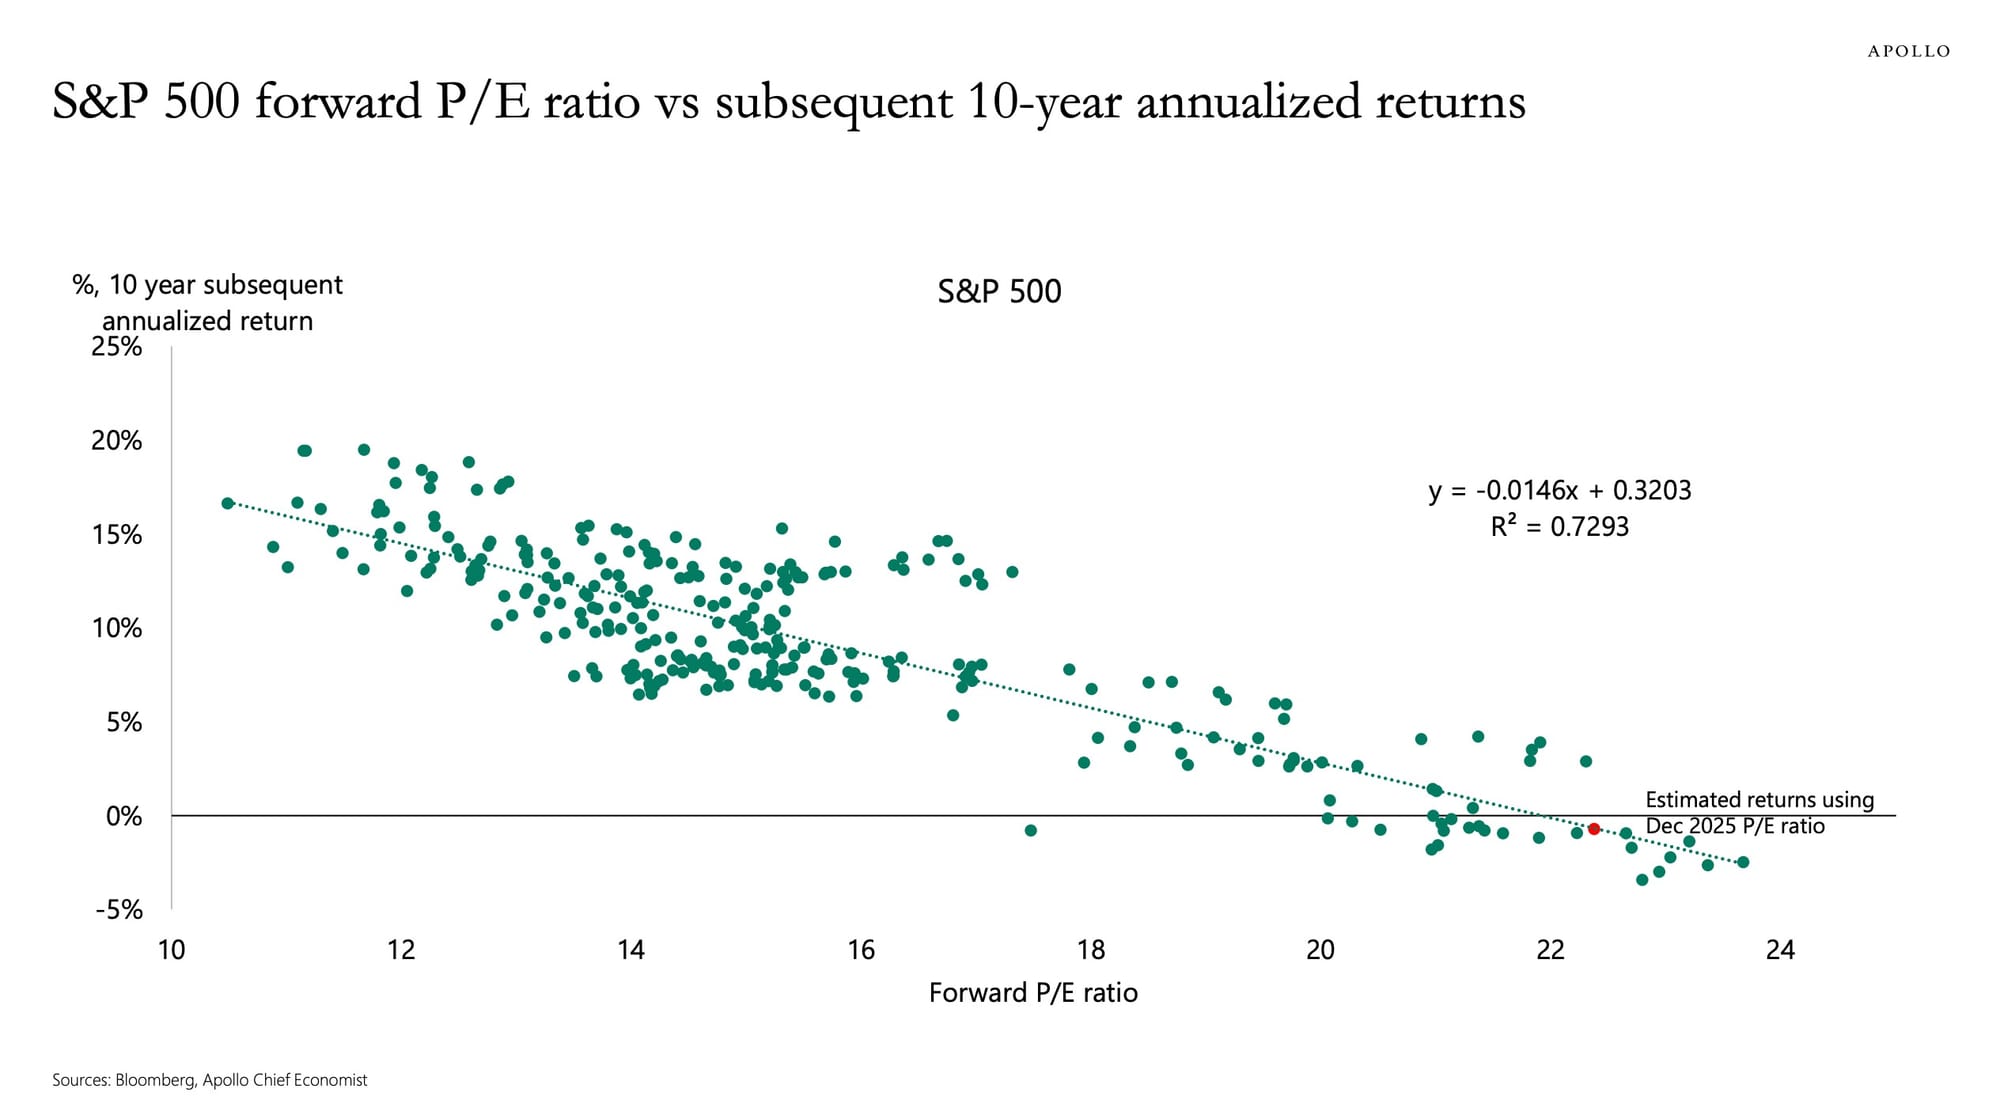
It shows how forward price-earnings multiples help predict 10-year annualized equity returns on the S&P 500. In particular, they can even produce negative return decades.
That should be uncontroversial, but it wasn't.
Analysts at growth investors Coatue weighed in, arguing that zero-return decades in equity markets are an "outlier", and that are unique to the .com era. They showed that in the following replication of the Apollo graph, highlighting post dot-com era decades' crap returns.
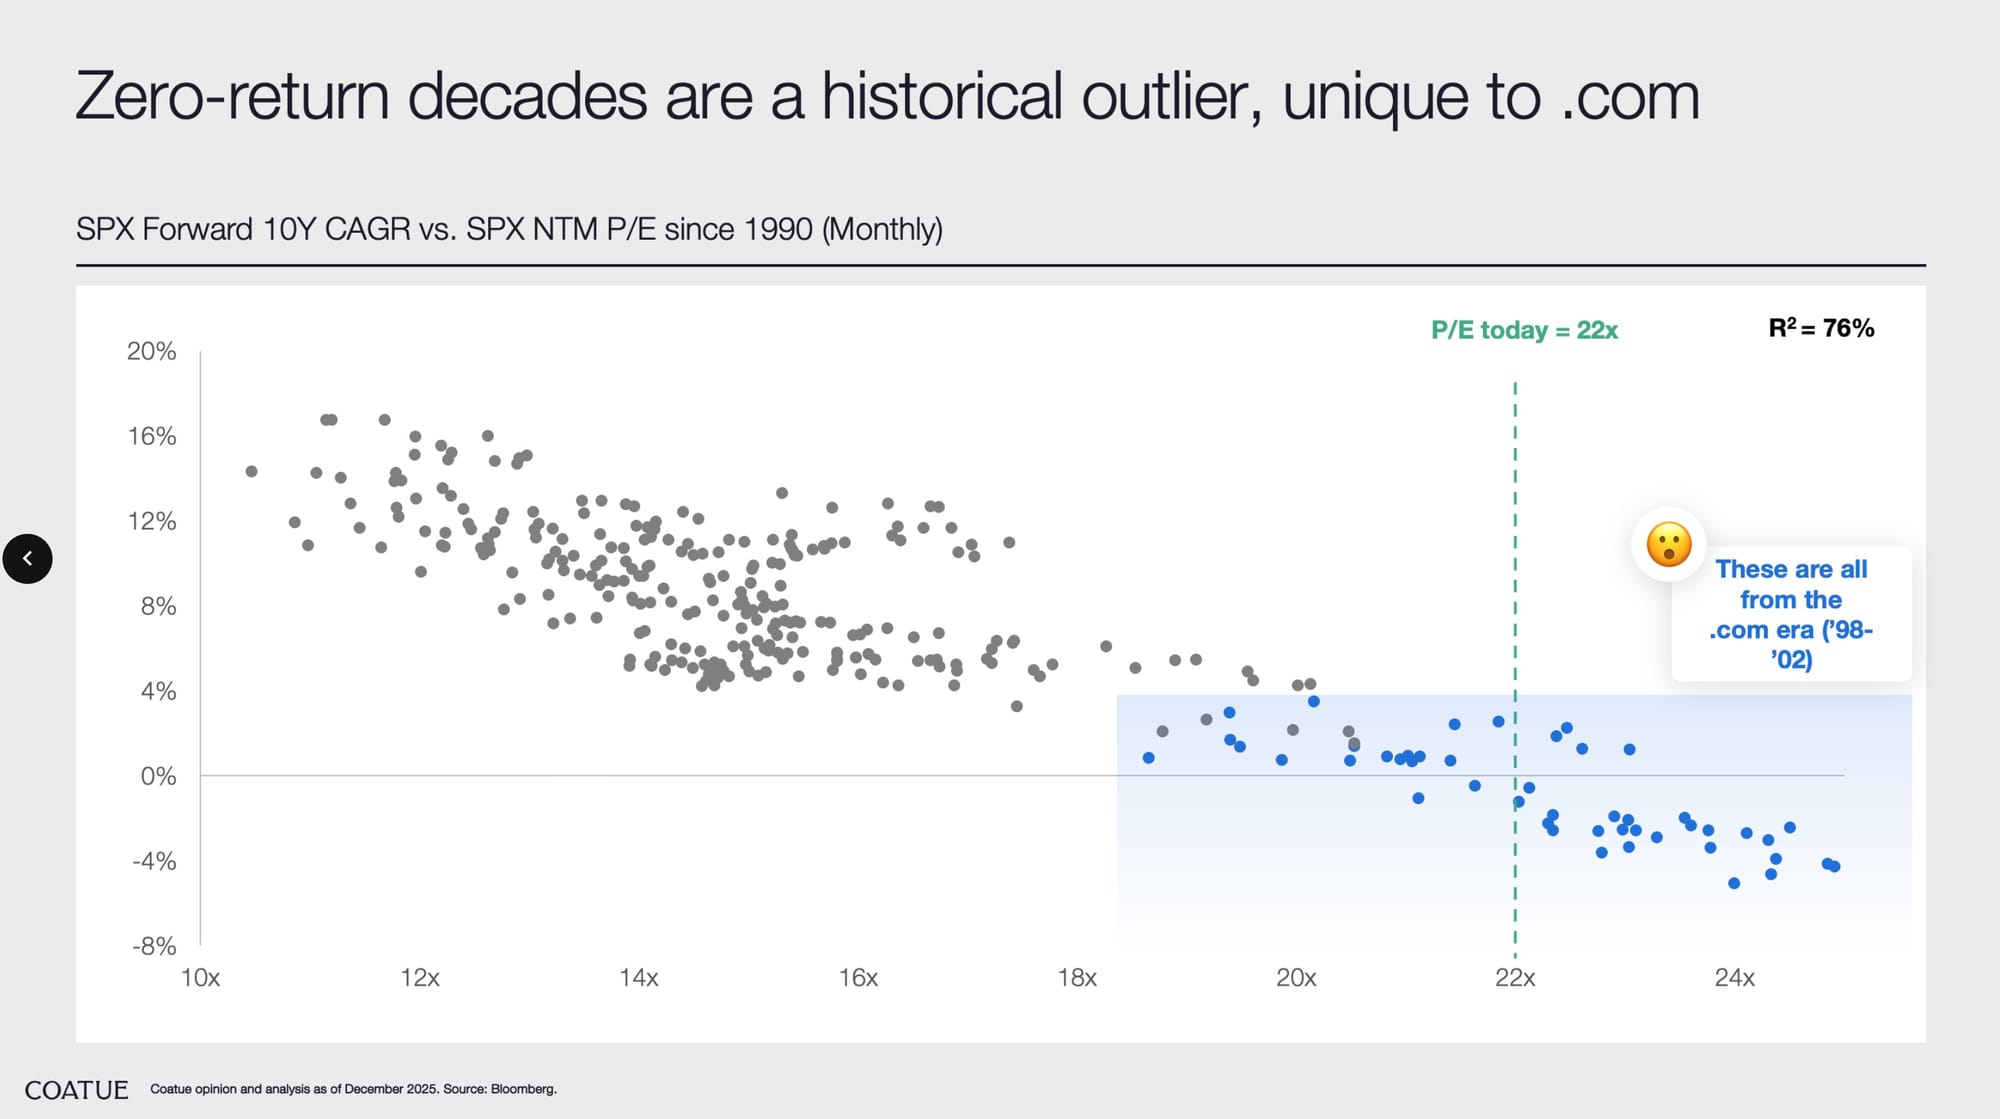
Who is right? Neither, honestly. Both make three serious errors:
- They constrain the data series to post-1990, limiting the number of overla[[ing decades.
- The post-1990s period was a regime change in equity markets, an era of falling rates and controlled inflation.
- They ignore look-ahead bias in forward estimates.
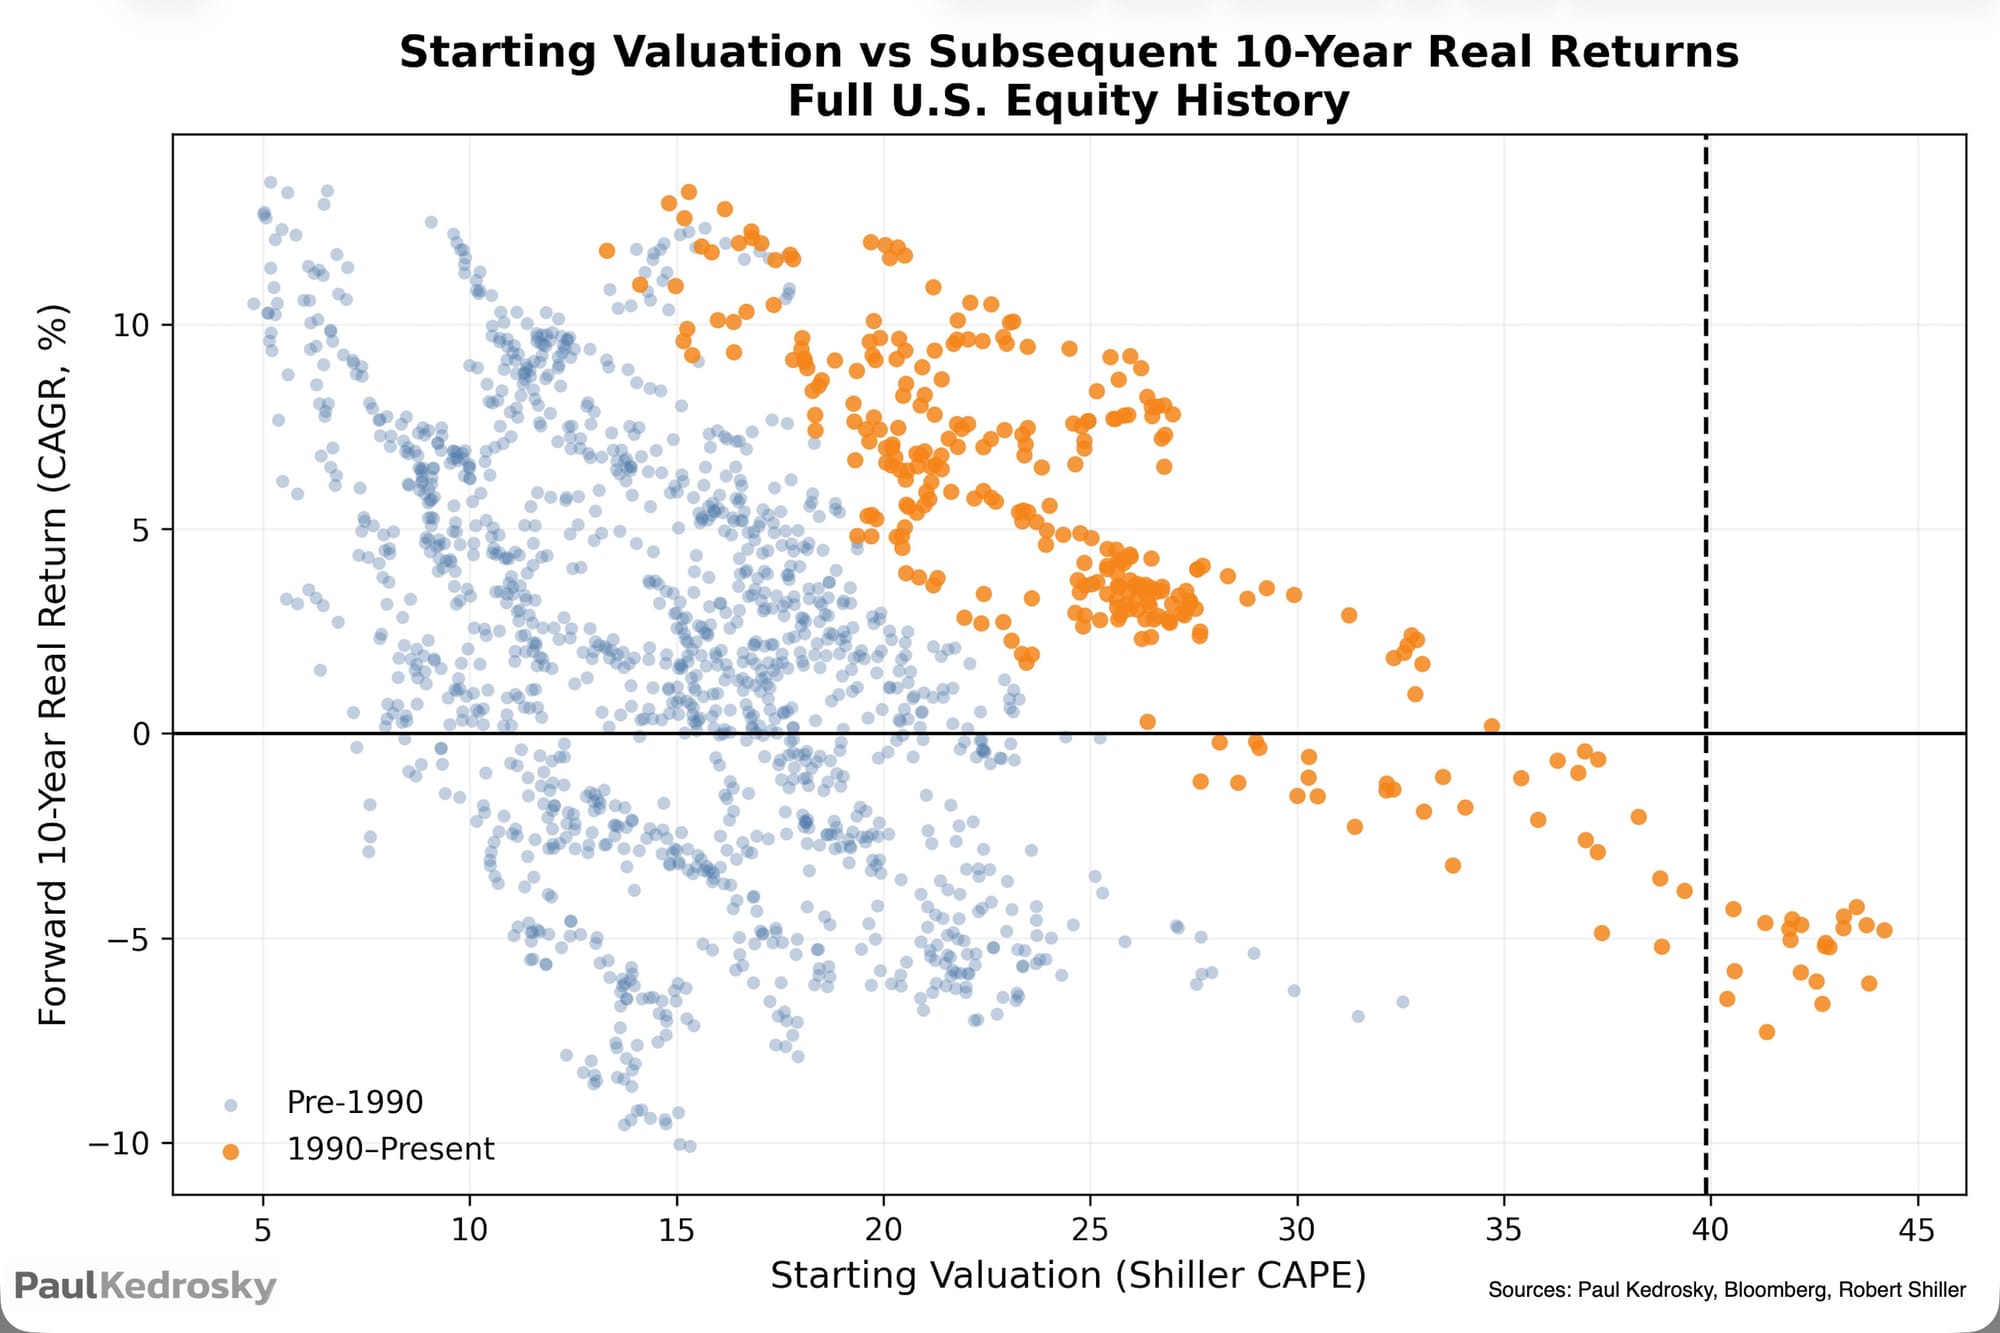
Here is what happens if you fix those issues. I went back to 1900, giving more decadal periods and reducing the importance of the dot-com episode. I also used Shiller's cyclically-adjusted price-earnings multiple (CAPE) to reduce the impact of cycles and estimates.
You can see the result below. While the dot-com era poor decadal returns are still there, there are many ten-year periods with negative returns, most of them starting from much lower forward multiples than the dot-com era did.
You can also see, via the color coding, the regime change in post-1990 data. Declining interest rates led, in large part, to higher equity market valuations overall, as showm by lower multiples with similar, if messy, effects on outcomes.
The takeaways:
- Valuation is not destiny
- Valuation is also not irrelevant
- Valuation is a persistent, first-order constraint on long-run real returns across regimes
- Dot-com is neither necessary nor sufficient to establish that fact
Bonus:
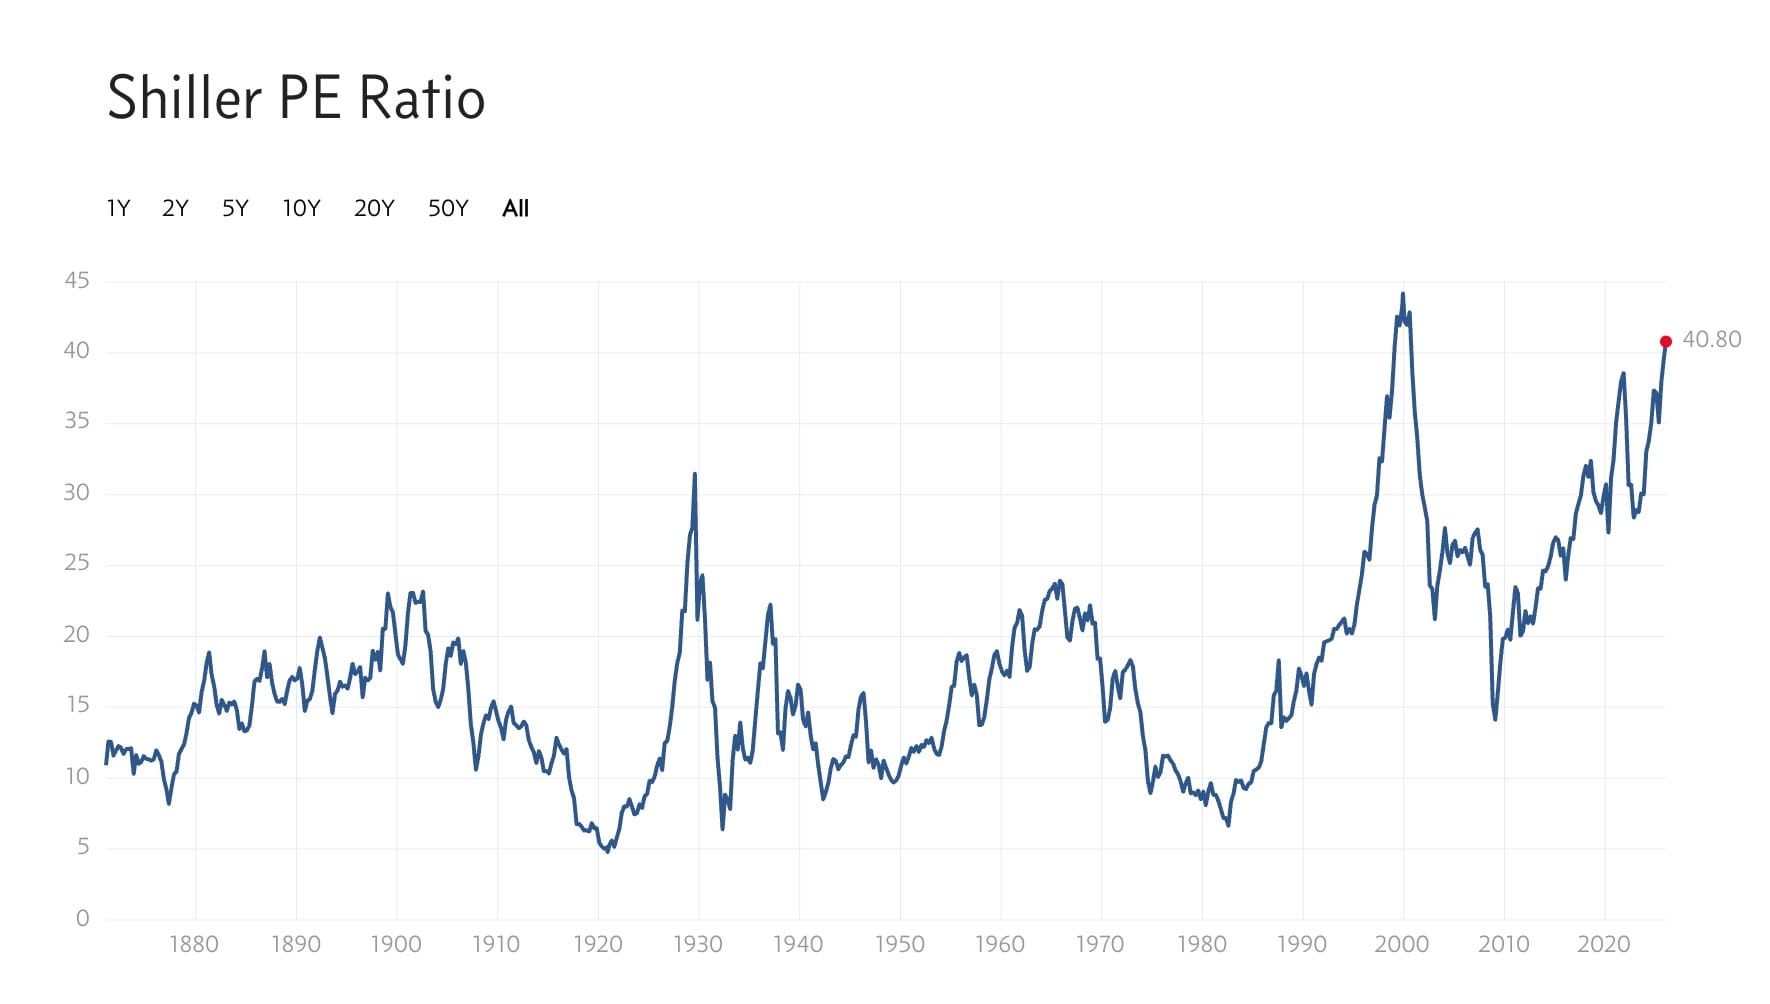
Shiller CAPE graph, showing the current historical outlier CAPE: